Exposing the 200ms Bottleneck: How an E-Commerce Giant Accelerated Checkout with Linkerd & Grafana
From Hidden Lag to Lightning-Fast Checkouts: A Linkerd + Grafana Success Story in E-Commerce
Introduction
In an age where microseconds can mean the difference between a customer completing a purchase or abandoning their cart, e-commerce companies constantly seek ways to optimize performance. For large platforms, the complexity of a microservice architecture can make it challenging to pinpoint exactly where latency creeps in. This case study spotlights a major e-commerce organization (henceforth, “ShopLink”), which recently embarked on a performance-enhancement project. Their goal: reduce friction in the checkout process to increase conversions and overall revenue.
Rather than blindly guessing about possible bottlenecks, ShopLink adopted Linkerd—a lightweight service mesh—to gather fine-grained observability data on every request. By integrating these metrics with Grafana, the team quickly discovered a hidden 200ms overhead in one microservice call integral to the checkout flow. Through root-cause analysis, code optimizations, and strategic updates, they eliminated the bottleneck and significantly sped up the entire checkout user experience. This case study details how they achieved that.
Background: ShopLink’s Microservice Architecture
A Rapidly Evolving System
ShopLink grew rapidly, evolving from a monolithic PHP application to a sprawling microservice ecosystem. Services handling user profiles, product catalogs, payment gateways, inventory, and shipping quotes all needed to coordinate seamlessly. However, as the organization scaled, engineering teams introduced multiple languages (Java, Go, Node.js) and frameworks, leading to diverse performance footprints and complicated interactions.
Key Challenges
Inconsistent Observability: Some microservices implemented custom logging or partial instrumentation, but there was no uniform approach to measuring real-time latency or error rates.
User Complaints: A small but vocal subset of customers complained about slow checkout times, causing frustration and increased cart abandonment.
Competitive Pressures: Rival online retailers boasted faster load times, and user research suggested that every additional 100ms of latency negatively impacted conversions.
Why Linkerd and Grafana?
Linkerd’s Minimal Overhead
While exploring service mesh solutions, ShopLink compared Istio, Consul, and Linkerd. The engineering team preferred Linkerd for its lightweight, minimal overhead approach. They reasoned:
Simplicity: Linkerd’s “batteries-included but not overly complicated” design appealed to multiple squads with varying levels of mesh experience.
Low Resource Footprint: Their existing clusters often faced CPU constraints during peak shopping seasons. Linkerd’s smaller sidecar proxies and control plane overhead fit better than heavier alternatives.
Grafana for Visualization
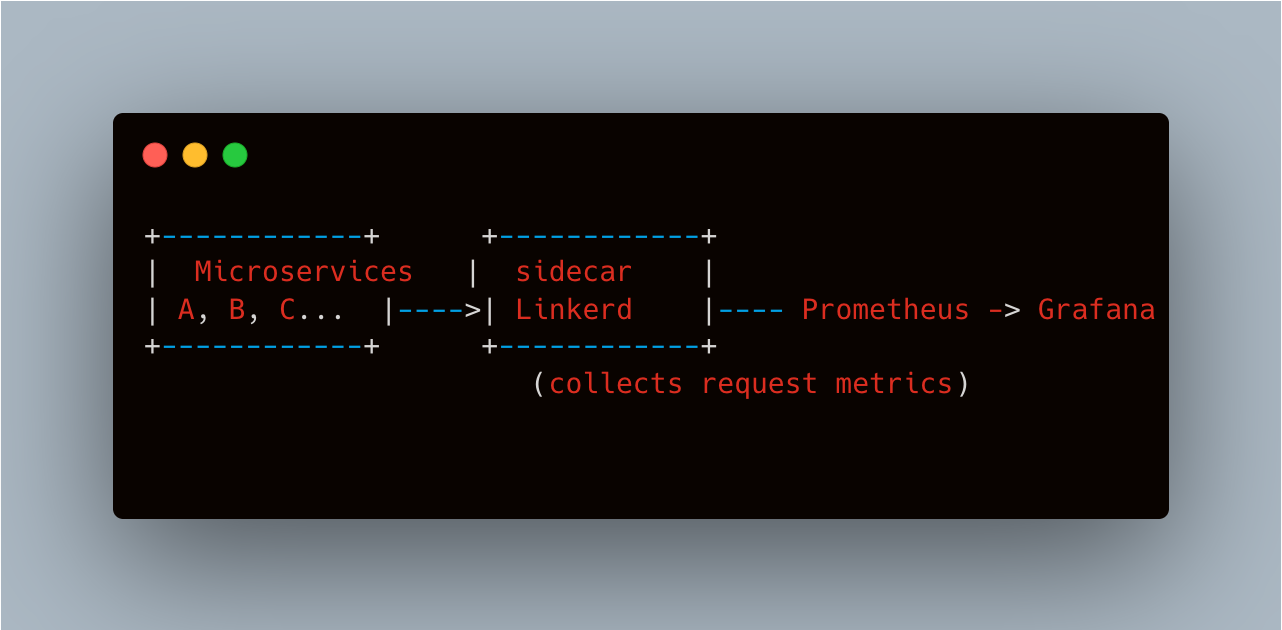
ShopLink already used Prometheus for metrics collection in production. Grafana was the natural choice for building dashboards:
Data Aggregation: Linkerd’s built-in telemetry fed into Prometheus, which Grafana queried for timeseries insights.
Cross-System Views: Because many teams used Grafana for node metrics (CPU, memory, disk I/O), adding service mesh metrics in the same interface simplified correlation of container-level and service-level data.
Project Launch: Rolling Out Linkerd
Step 1: Canary Deployment
Since enabling a service mesh can be disruptive, ShopLink started with a small canary in their Staging environment. They injected Linkerd sidecars into the checkout microservices:
Payment gateway service
Cart service
Shipping rate service
Order aggregator
Their immediate objective was to confirm no critical regressions appeared and that Linkerd overhead remained below 5ms.
Command Output (abbreviated) from a staging environment setup:
# Install Linkerd CLI
curl -sL https://run.linkerd.io/install | sh
# Validate
linkerd check --pre
# Inject the service
kubectl get deploy checkout -o yaml | linkerd inject - | kubectl apply -f -
Step 2: Observability Dashboard in Grafana
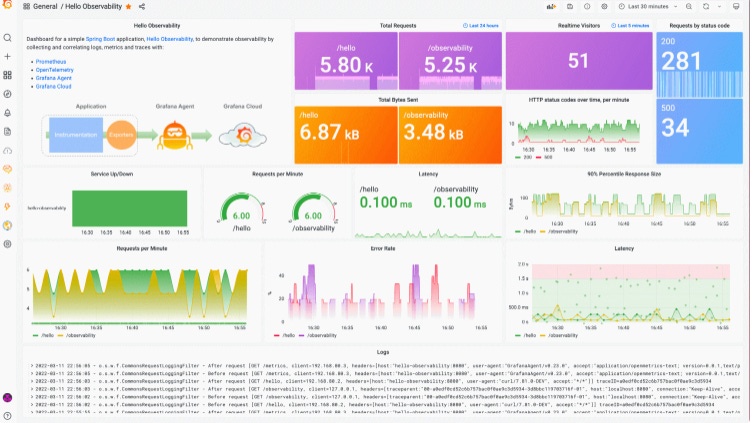
Within days of the canary deployment, the DevOps team built a Grafana dashboard to visualize metrics from Linkerd:
P95 & P99 latencies
Request volume per service
Success/error rates
TCP connections (where relevant)Step 3: Full Production Roll-Out
Encouraged by staging results, ShopLink incrementally scaled Linkerd injection to more services in production, starting with non-critical microservices. Over a two-week period, the entire checkout domain was brought into the mesh with minimal disruptions.
Discovering the 200ms Overhead
Initial Observations
Shortly after rolling out Linkerd and finalizing the Grafana dashboards, the DevOps team noticed a small but consistent 200ms latency spike on 5-10% of calls to the Shipping Rate microservice. This microservice was invoked multiple times during checkout: once when the user enters their address, and again for final cost calculations. The overhead was significantly affecting user-perceived load times.
Real Log Excerpt (illustrative):
Step 3: Full Production Roll-Out
Encouraged by staging results, ShopLink incrementally scaled Linkerd injection to more services in production, starting with non-critical microservices. Over a two-week period, the entire checkout domain was brought into the mesh with minimal disruptions.
Discovering the 200ms Overhead
Initial Observations
Shortly after rolling out Linkerd and finalizing the Grafana dashboards, the DevOps team noticed a small but consistent 200ms latency spike on 5-10% of calls to the Shipping Rate microservice. This microservice was invoked multiple times during checkout: once when the user enters their address, and again for final cost calculations. The overhead was significantly affecting user-perceived load times.
Real Log Excerpt (illustrative):
time="2024-06-21T10:15:42Z" level=info msg="Request /shippingRate completed in 450ms (expected <250ms), potential overhead=200ms"
time="2024-06-21T10:15:42Z" level=debug msg="Linkerd tracing: request route ID=72c1-l4c"
Pinpointing the Root Cause
Armed with Linkerd’s request-level stats, the SRE and shipping service teams traced the calls. They discovered that certain addresses triggered repeated geolocation queries—some addresses were missing local cache entries, causing fallback to an external geocoding API. The shipping service then performed computationally expensive distance calculations each time.
Key insights:
Cache Miss Rate: The shipping microservice’s in-memory cache was undersized, and certain data would quickly be evicted.
Slow API: The external geocoding service had a suboptimal query path.
Unnecessary Loops: The code triggered multiple geocoding calls for a single request if the address had partial matches.
Without Linkerd’s breakdown of request latencies, the team would have spent more time guessing or attempting to replicate load test scenarios. Instead, the service mesh data quickly isolated the shipping microservice as the culprit.
Optimization and Results
Code Improvements
Shipping Microservice changes:
Larger Cache: Adjusted the LRU cache size from 1,000 to 10,000 addresses, reducing evictions.
API Call Consolidation: Bundled multiple geocoding lookups into a single request, then parsing results once.
Background Prefetch: For popular address patterns (e.g., certain zip codes near distribution centers), the microservice periodically prefetches geocoding data to ensure it’s warm in the cache.
Infrastructure Tweaks
The external geocoding API calls were also subject to NAT gateway constraints. By introducing a small container-based proxy closer to the shipping microservice, they reduced round-trip times by 20ms. Another fix included ensuring that any major geocoding libraries were updated to the latest version, gaining performance enhancements.
Checkout Speed Gains
After deploying these optimizations:
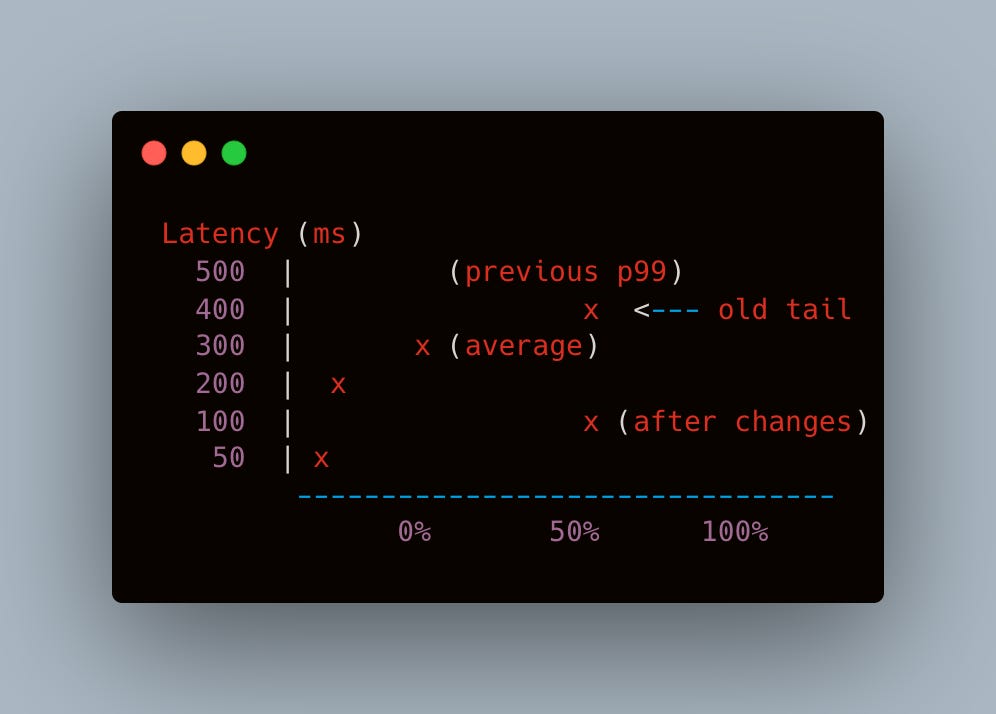
Median shipping microservice time dropped from ~250ms to ~80ms.
Worst-case tail latencies (p99) improved by 300ms to 400ms.
The overall checkout path (from cart finalization to address confirmation) felt notably snappier for end users, with an average improvement of 200ms.

Before & After Microservice Latency Chart linkerd console, illustrating the drop in shipping service latency over time Broader Organizational Impact
Reduced Cart Abandonment
Although quantifying an exact correlation can be tricky, ShopLink measured around a 0.7% drop in cart abandonment in the weeks following the fix—a not-insignificant figure for a major e-commerce site generating hundreds of thousands of daily transactions. Faster shipping cost calculations kept impatient users engaged and more confident in the final checkout steps.
Empowering Developer Teams
By giving every service squad direct access to Linkerd metrics in Grafana, debugging responsibilities became more distributed. No longer did the SRE team have to be gatekeepers of performance data. Dev squads could see real-time latencies and request volumes, quickly diagnosing anomalies in their own microservices.
Culture Shift to Observability-First Mindset
Prior to Linkerd, some teams were content with approximate logs or shallow instrumentation. The success in pinpointing a single 200ms overhead significantly boosted confidence in “observability-first” patterns. More squads introduced structured logging, distributed tracing, and performance testing in staging to catch such regressions earlier.
Challenges and Lessons Learned
Service Mesh Complexity
Although Linkerd is simpler than other meshes, it still introduced complexities:
Sidecar Injection: Some microservices needed additional environment variables or resource allocations to handle the sidecar overhead.
Configuration Drift: Different namespaces or teams sometimes forgot to inject Linkerd or used outdated injection commands. The DevOps team eventually automated injection in the CI/CD pipeline to prevent version mismatches.
Data Deluge
With so many microservices, the volume of metrics soared. The Prometheus instances occasionally struggled with memory usage. Tuning retention periods, using Prometheus federation, or a dedicated metrics store (like Thanos or Mimir) became a priority to handle the data flood.
Continuous Tuning
Finding one major bottleneck was relatively straightforward once the mesh was in place, but more subtle, short-lived spikes can remain hidden. Ongoing performance monitoring and seasonal load testing are essential to ensure the platform remains fast year-round, especially during holiday spikes or promotional sales.
Final Reflections
In the journey to create frictionless e-commerce experiences, Linkerd gave ShopLink the clarity needed to identify and eliminate a persistent 200ms overhead in the shipping microservice’s logic. By combining these metrics with Grafana dashboards, the team quickly localized the root cause—insufficient caching and unnecessary repeated geocoding calls—leading to immediate performance gains.
Key Takeaways:
Lightweight Mesh, Big Gains: Linkerd’s minimal overhead and straightforward approach enabled a smooth rollout without significant resource bloat.
Holistic Observability: Integrating Linkerd metrics into an existing Grafana/Prometheus stack offered a unified view of both infrastructure health and service-level performance.
Pinpoint Bottlenecks, Then Act: Observability is only as good as the follow-up. Once the problem was visible, collaborative efforts by DevOps and the shipping microservice team led to code-level fixes.
Sustained Improvement: Performance optimization is an iterative process. The success in addressing this 200ms overhead encouraged more “performance champions” across ShopLink’s engineering squads.
By unlocking real-time data on microservice interactions, ShopLink not only sped up its checkout flow but also laid the foundation for an ongoing commitment to performance, reliability, and user-centric development. As they continue to scale, this combination of a lightweight service mesh and robust observability ensures they remain agile in detecting and resolving the next hidden bottleneck.
Conclusion
This story illustrates how a large e-commerce platform overcame a frustrating performance bottleneck by leveraging Linkerd for real-time service observability and Grafana for intuitive metric dashboards. The discovery of a 200ms overhead in shipping cost calculations—and the subsequent code refactoring—dramatically improved user experience and checkout speed. It also reinforced the importance of adopting an observability-first mindset across all engineering teams.
For e-commerce players—and indeed, any organization adopting a microservices approach—this case study highlights that with the right service mesh and the right data visualization tools, you can swiftly uncover performance anomalies that once lurked in the shadows, saving precious milliseconds that can translate into higher revenues and happier customers.


